
TradingView is a top-notch platform for technical analysis and trading, offering a rich set of tools and features to dissect various financial instruments, notably stocks.
Here are the steps on how to use TradingView for share analysis:
How do I get started with TradingView?
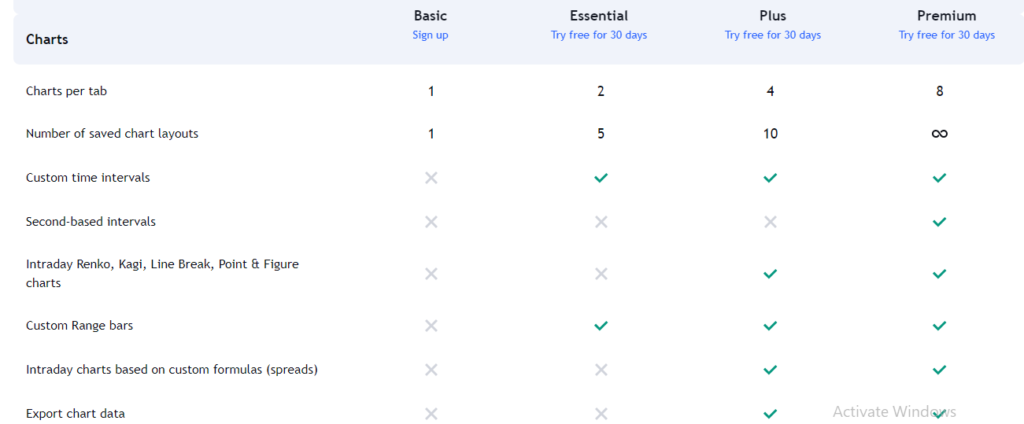
Create an Account: Begin by signing up for TradingView. It offers both free and paid plans. Paid plans offer more features than the free basic plan, such as custom time intervals, custom range bars, bar replay on intraday bars, webhook notifications, screener with auto refresh, data export, fastest data flow, the ability to buy extra real-time data from 70+ exchanges around the world, and a dedicated backup data feed.
Adding Stocks to Watchlist: Once logged in, you can add stocks to your watchlist. This enables easy monitoring of price movements and technical indicators for your chosen stocks.
Learn and Explore: To get the most out of TradingView, take advantage of the tutorials and resources that are readily available on the TradingView website and YouTube channel. These resources will help you learn how to use the platform’s features and functions, and improve your trading skills.
Chart Analysis: TradingView offers interactive, customizable charts for analyzing stock price movements over various timeframes (daily, hourly, etc.). Enhance your charts with technical indicators, drawing tools, and trend lines to spot patterns and trends.
Technical Indicators: TradingView provides various technical indicators, such as super trade, moving averages, Relative Strength Index (RSI), MACD, Bollinger Bands, and more. These indicators can help you assess the momentum, volatility, and potential trend reversals in share prices.
Drawing Tools: Use drawing tools to highlight support and resistance levels, trend lines, and critical price levels on your charts. These annotations provide valuable insights into potential price movements.
Stock Screeners: TradingView offers stock screeners to filter stocks based on specific criteria like price, volume, technical indicators, and fundamental metrics.
Seek Assistance: Don’t hesitate to ask for help if you encounter difficulties. TradingView provides ample resources, including support from their team, to aid you in your journey.
Social Networking and Ideas: Engage with the social aspect of TradingView, where traders share their insights, analyses, and predictions. Follow experienced traders, learn from their expertise, and participate in discussions.
Backtesting and Strategy Development: If you’re interested in developing and testing trading strategies, You can create custom indicators and processes with the help of TradingView’s Pine Script programming language. You can backtest these strategies on historical data to assess their performance.
News and Fundamental Analysis: Keep in mind that while TradingView excels in technical analysis, it also offers news feeds and fundamental data for stocks. For comprehensive fundamental analysis, supplement TradingView with other financial news sources and platforms.
Customer Support: Should you need assistance, TradingView provides customer support via email and live chat, typically responding within 24 hours.
Conclusion:
In summary, TradingView is a robust platform for technical analysis and charting. However, it’s crucial to consider the factors outlined above before diving in. Successful trading demands a blend of technical and fundamental analysis, effective risk management, and a well-defined strategy. While TradingView is a potent tool, thorough research and the consideration of various factors before making trading decisions remain essential.